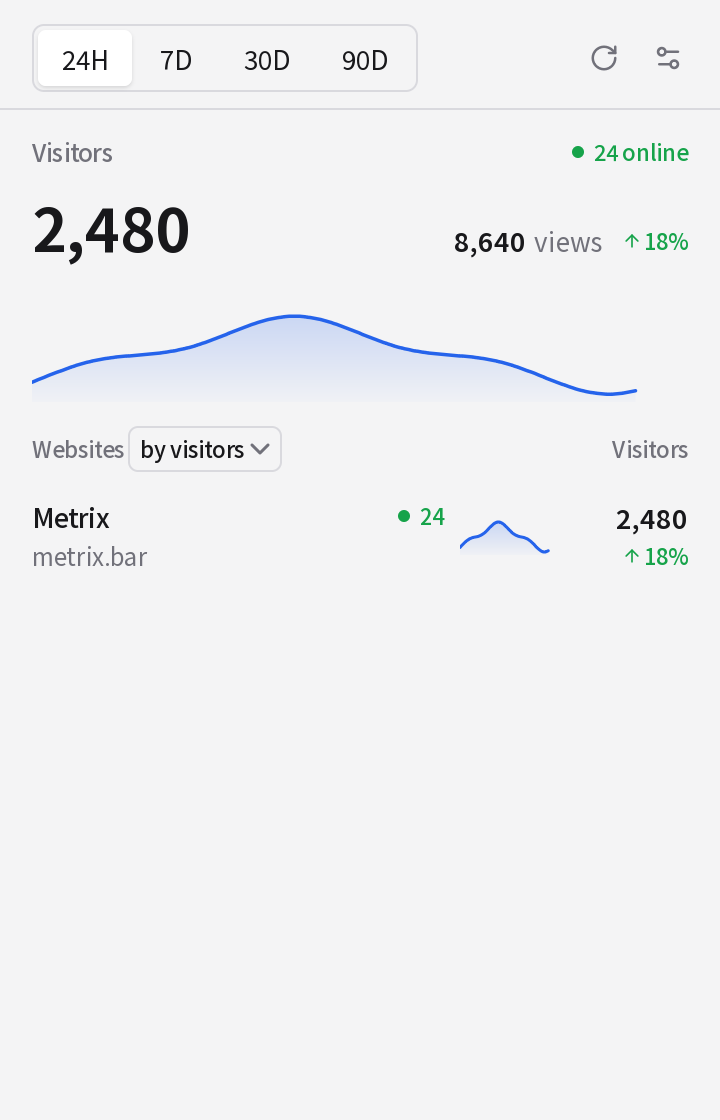
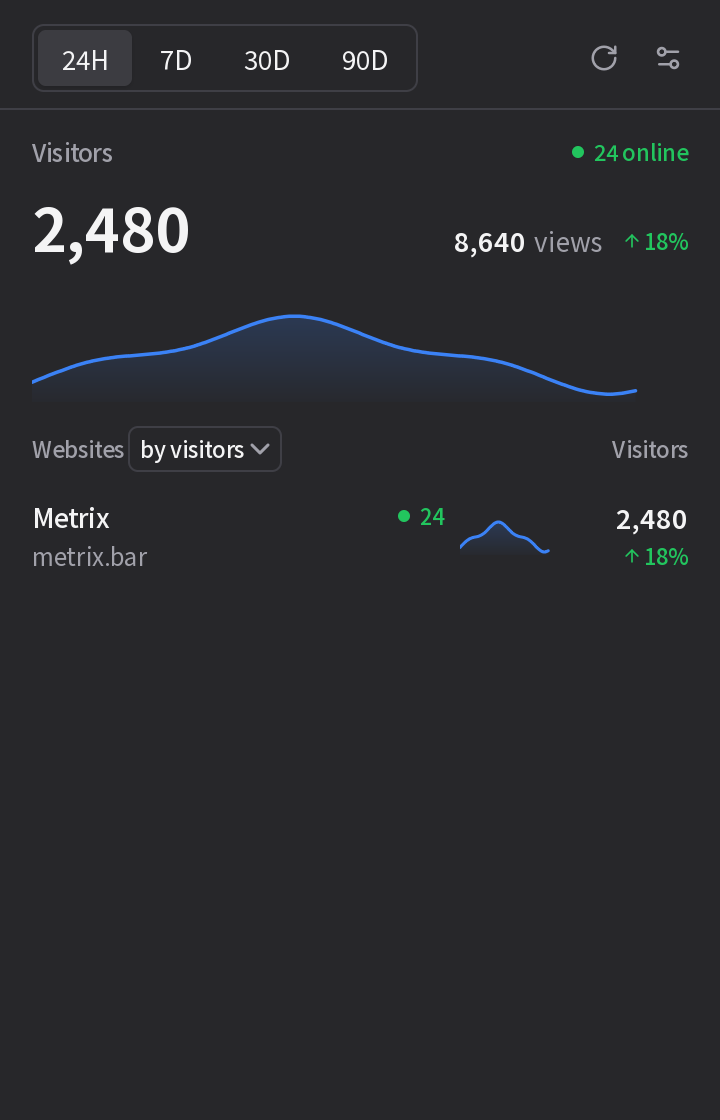
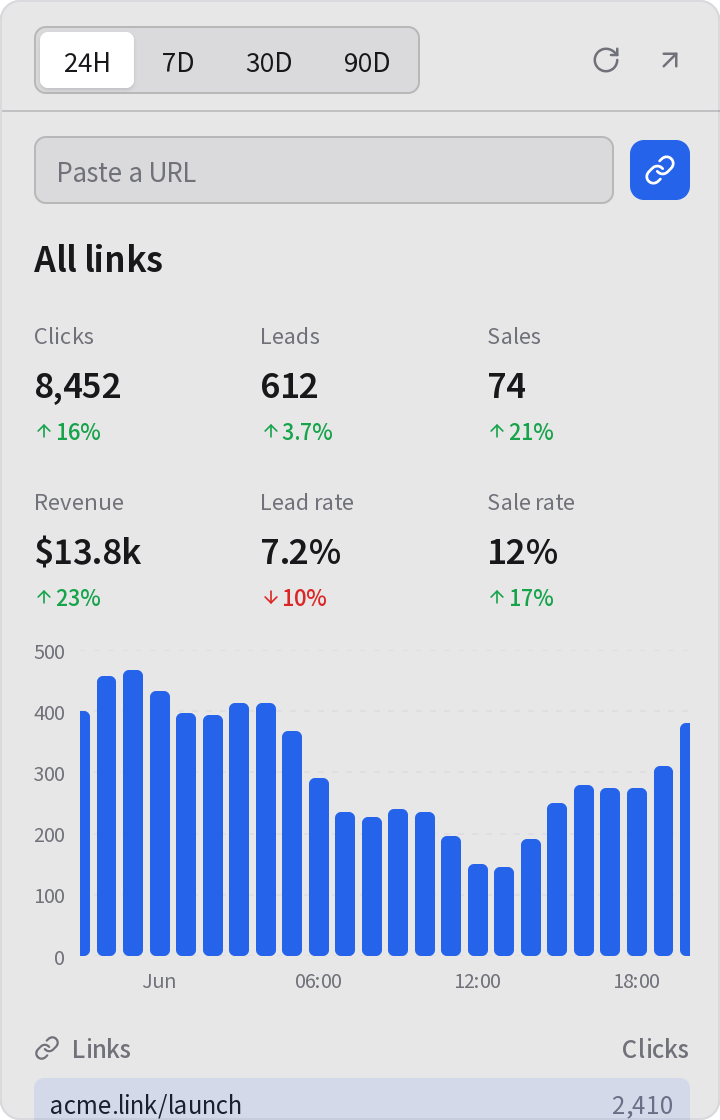
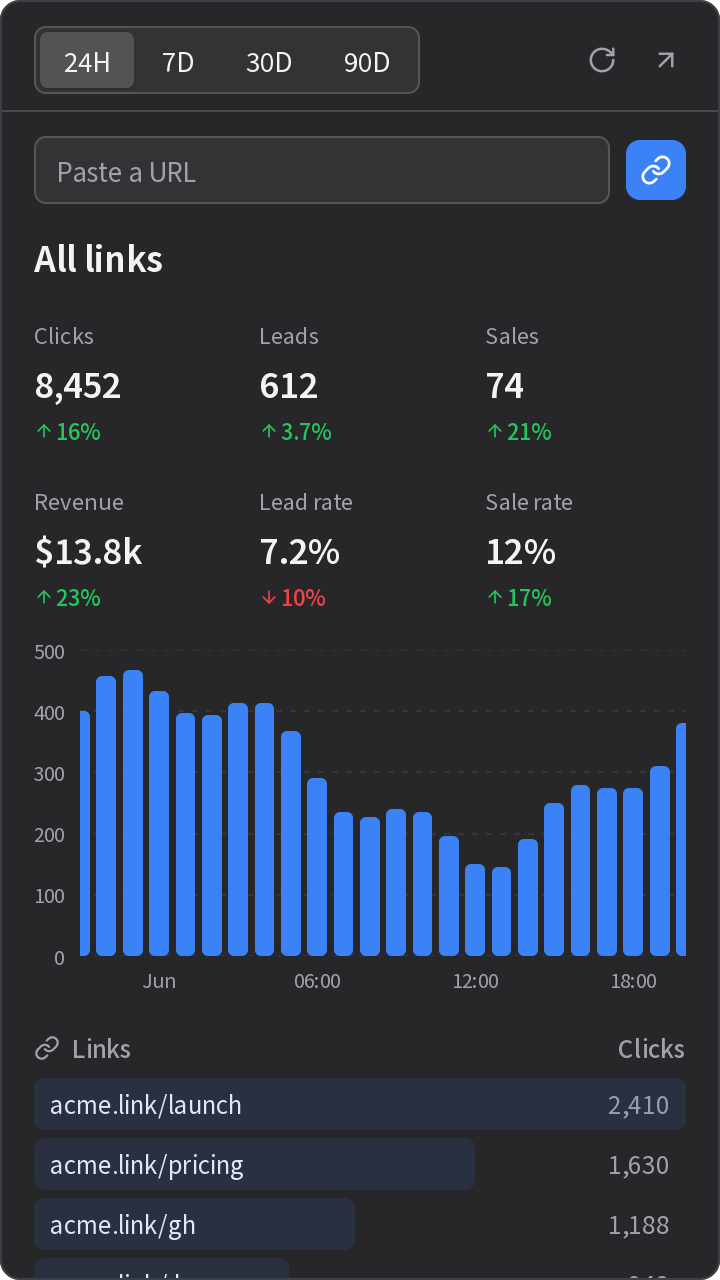
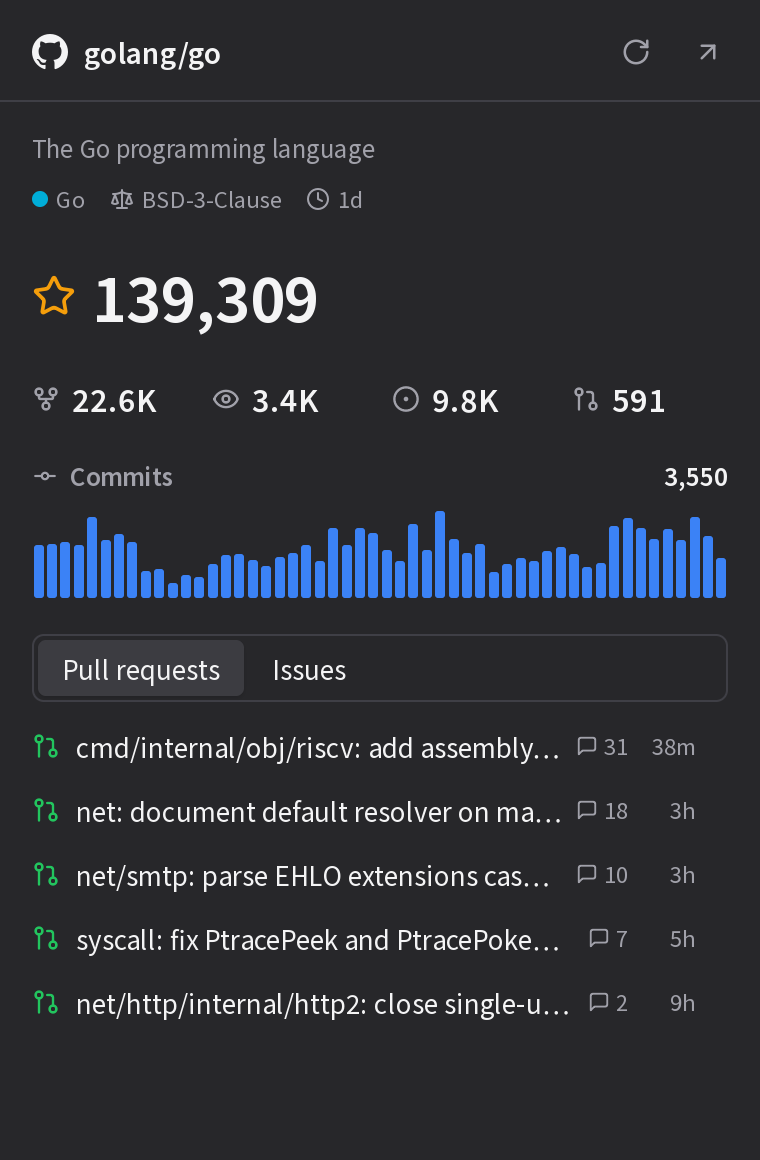
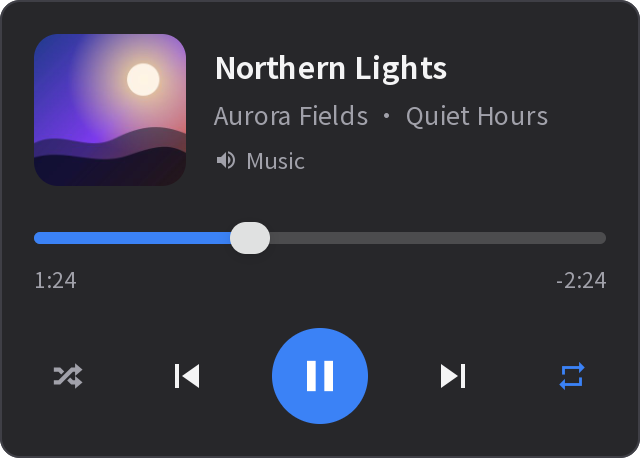
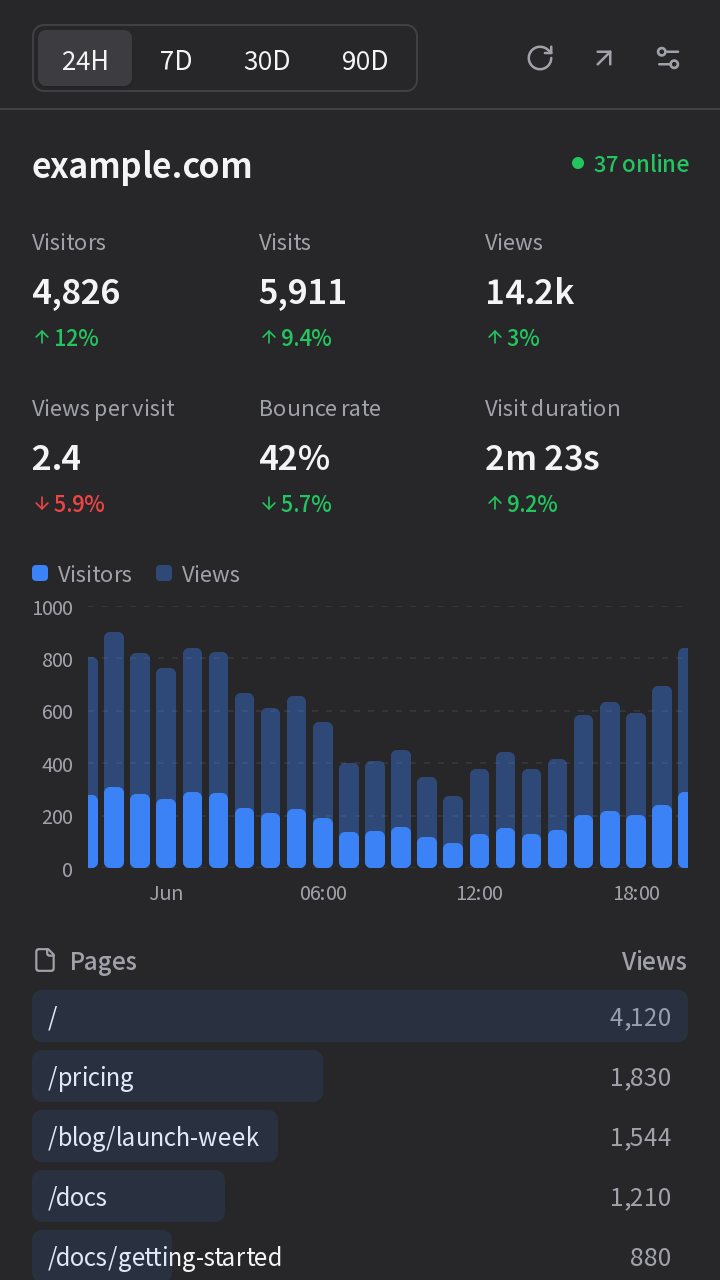
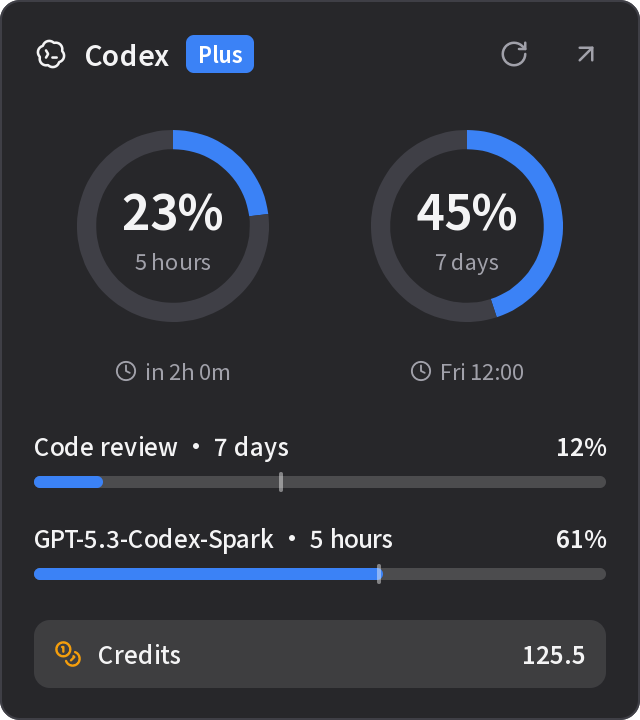
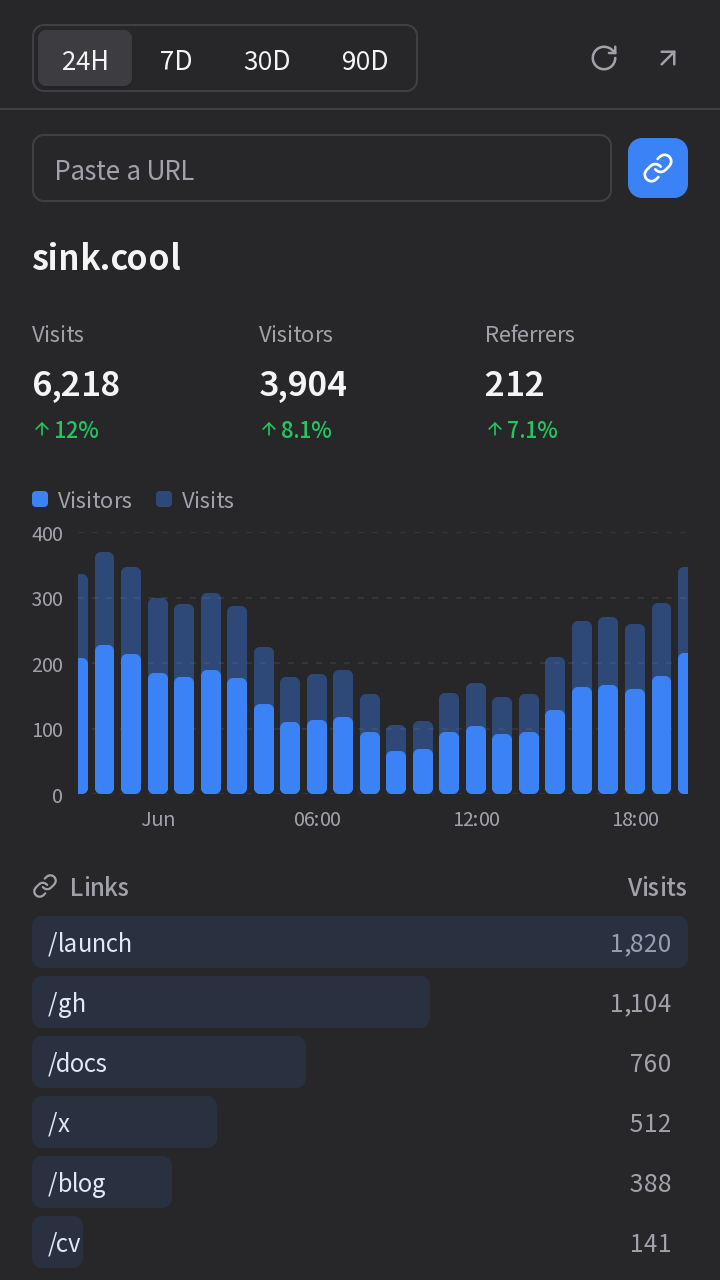
Real render, sample data
The menu bar app that builds any menu bar app.
Start with official dashboards, add the community’s, and let your agent build the rest. Each one runs natively in your menu bar, notch, and widgets.
v0.3.2 · macOS 13.0+ · Windows 10+ · Linux (Exp)
Start with ours. Add the community’s. Build your own.
Whoever writes it, every dashboard is one .bar file on the same native host. Official dashboards show what is possible; the ones you build fit exactly what you need.
Official dashboards
The foundation
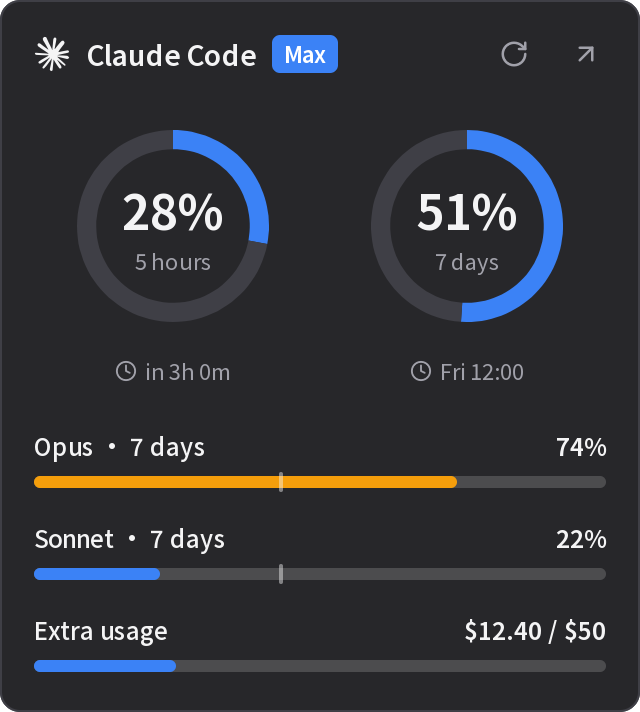
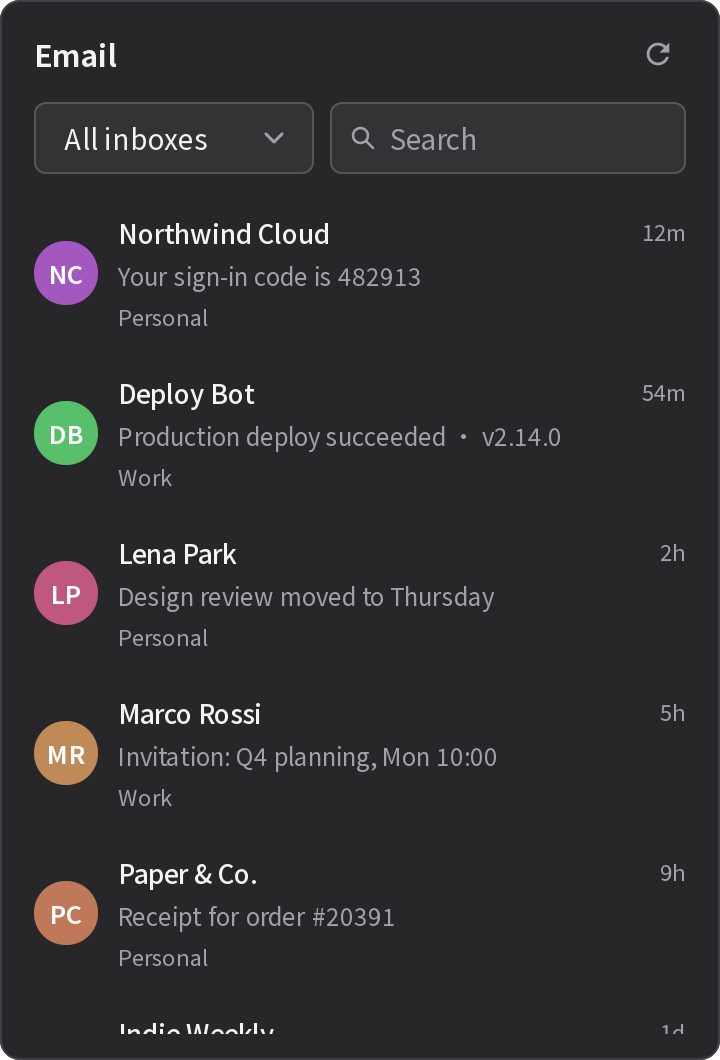
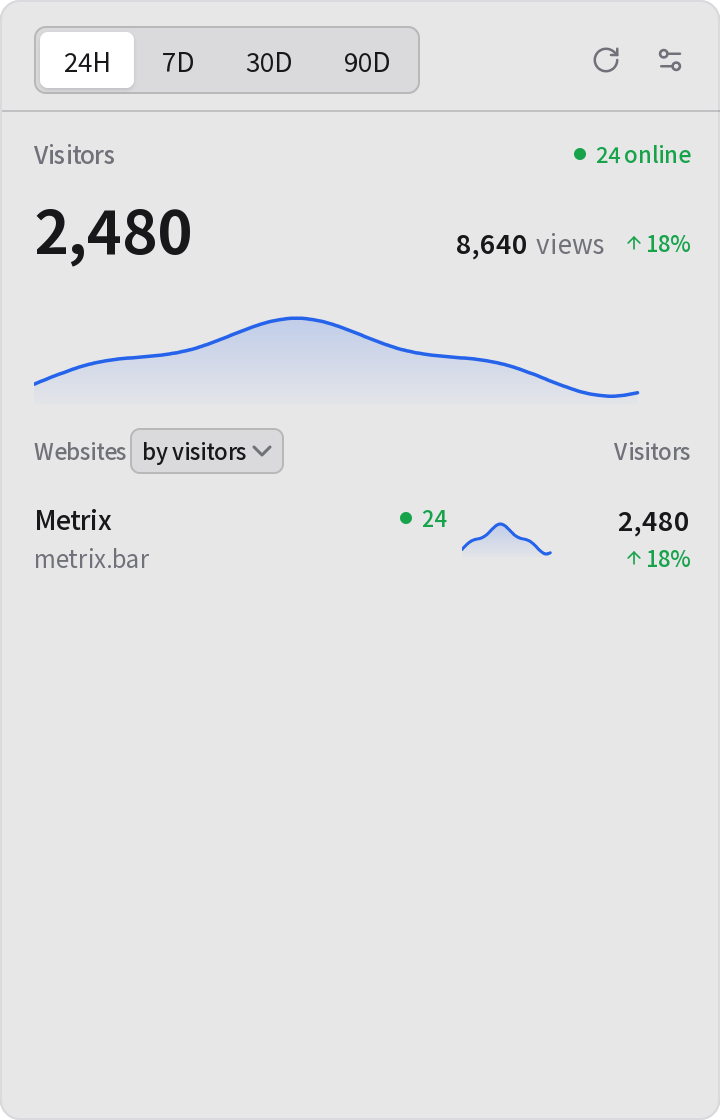
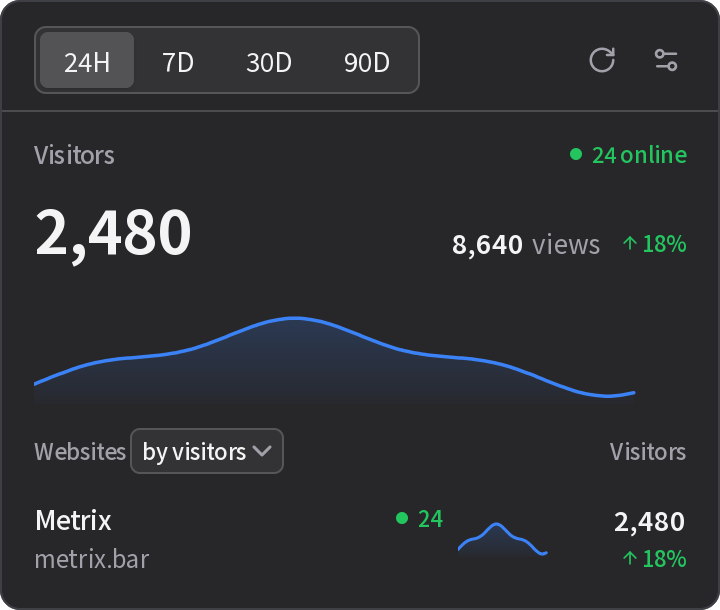
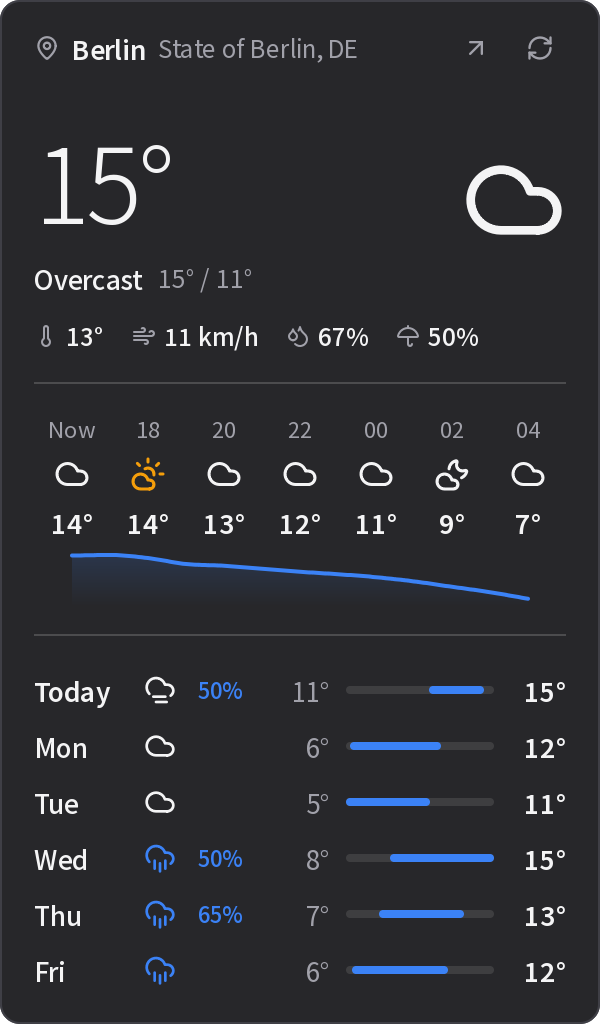
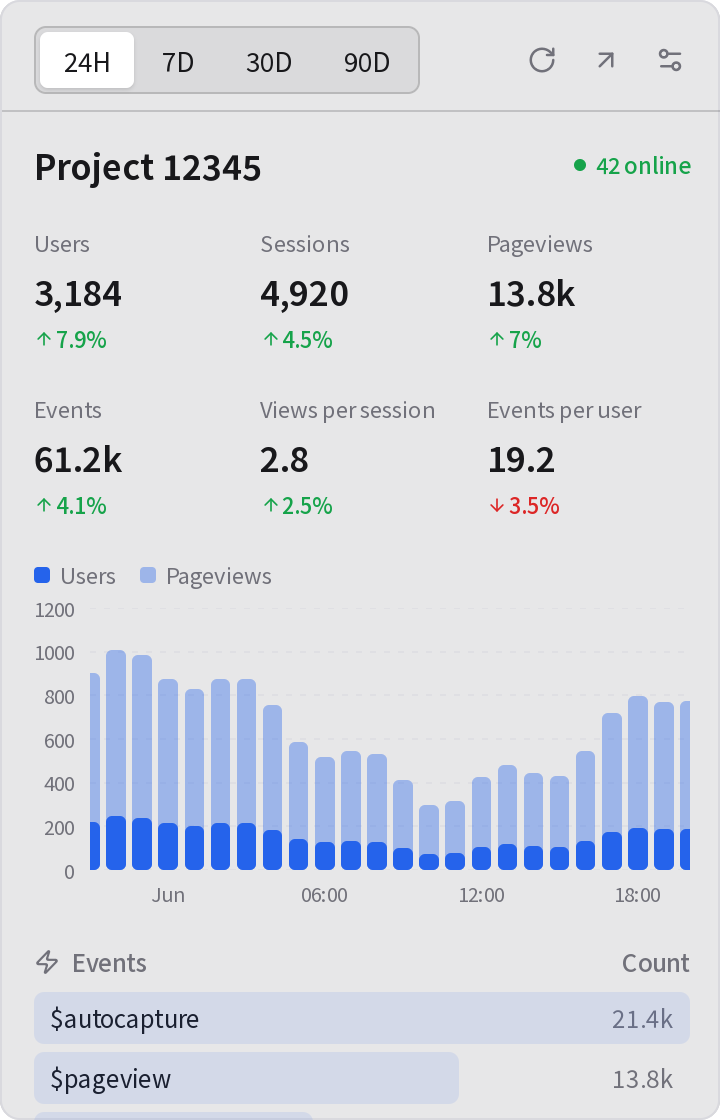
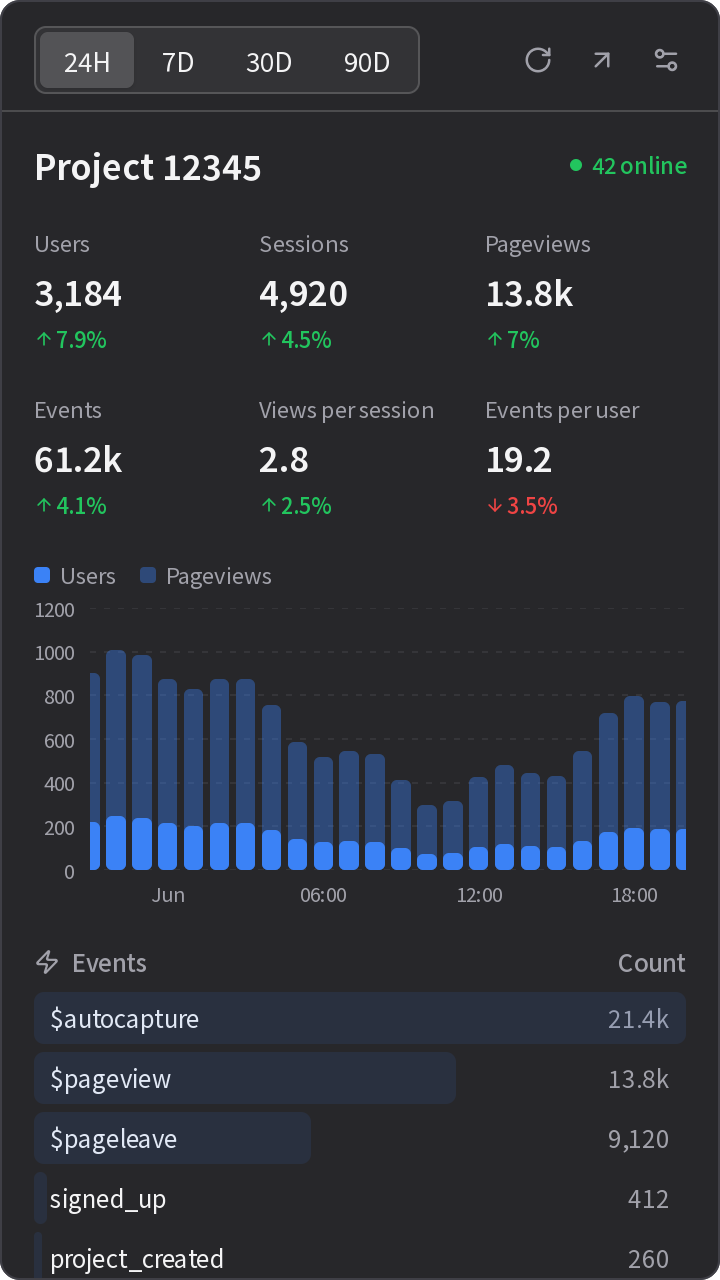
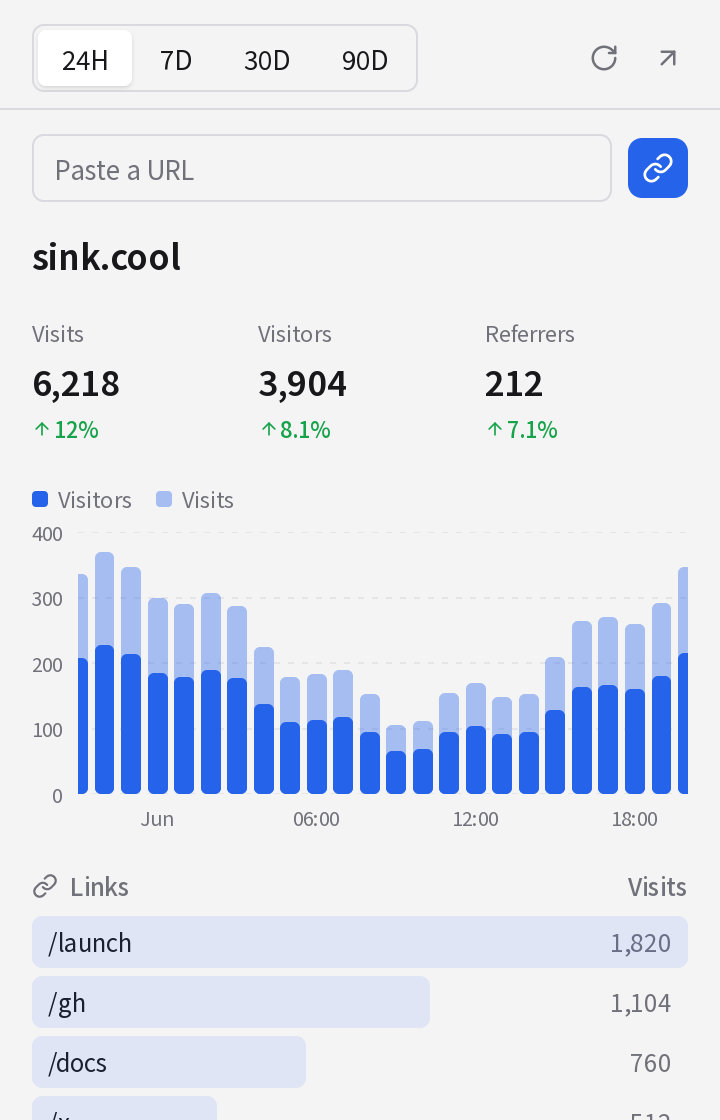
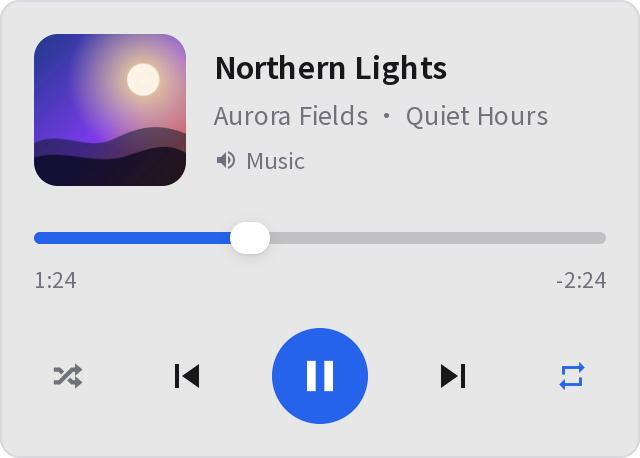
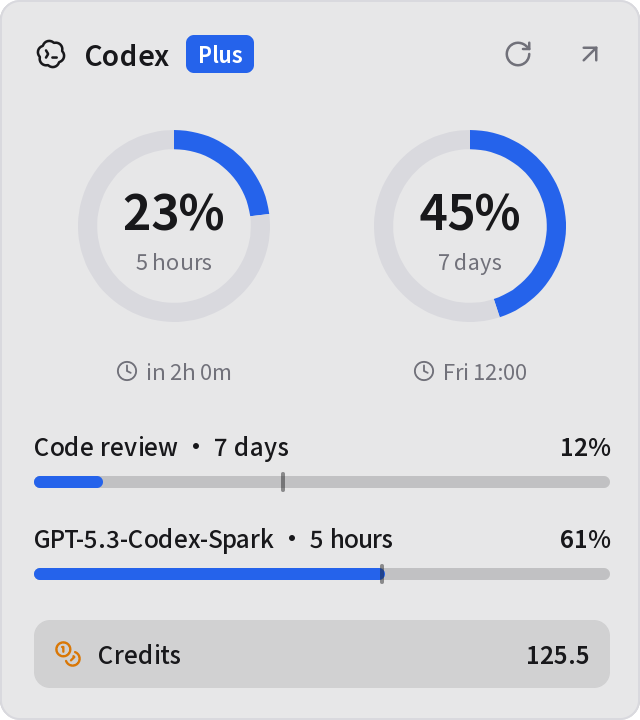
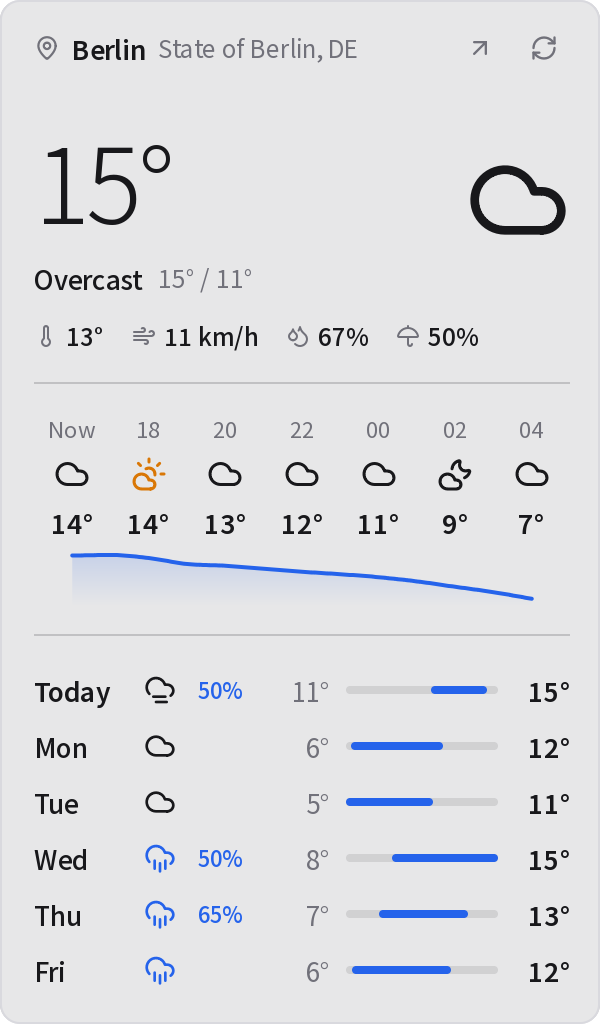
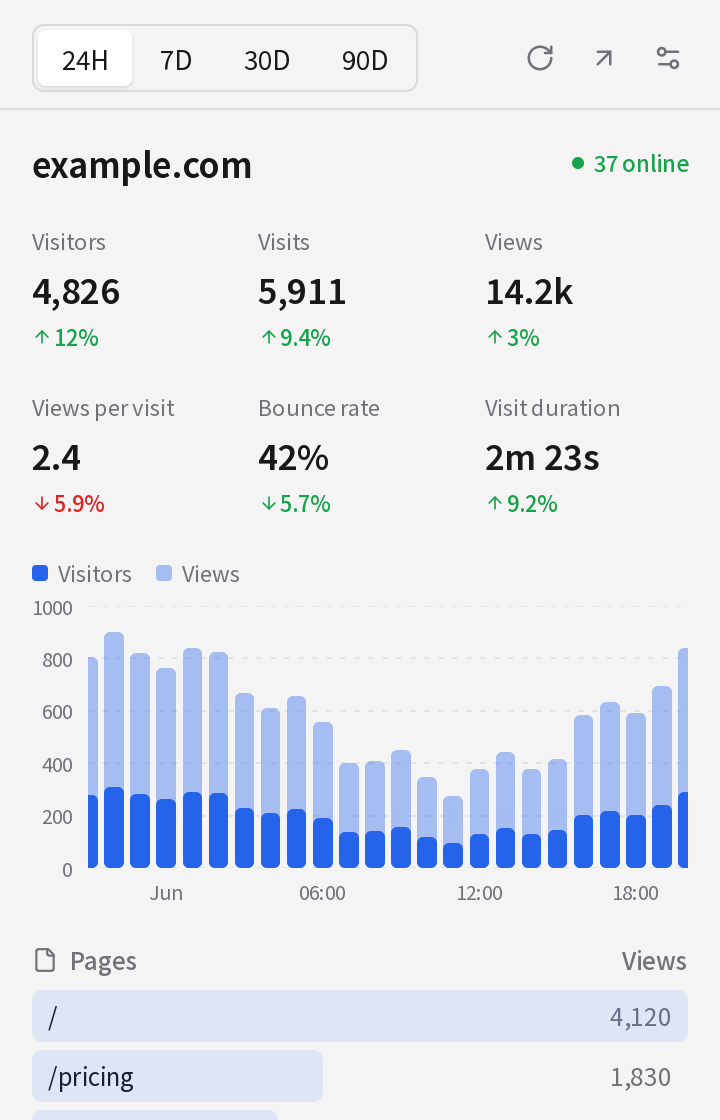
Ready to use: Claude Code and Codex usage, GitHub, music, email, system monitoring, weather, and web analytics. Install, add a token, done.
Browse the galleryCommunity dashboards
The extension
The Awesome.Metrix.Bar community source is on by default. Add any other registry, or host one for your team.
Explore Awesome.Metrix.BarYour dashboards
What matters most
Your services, your numbers, your workflow. Describe it to Claude Code, Codex, or Cursor, or sketch it in the browser Playground, and keep the .bar file you own.
Build your first dashboard
One dashboard, every way in
Glance at the menu bar or the notch, reach a screen edge, press a key, add a widget, or launch it as its own app. Each dashboard picks its ways in, and how its panel opens.
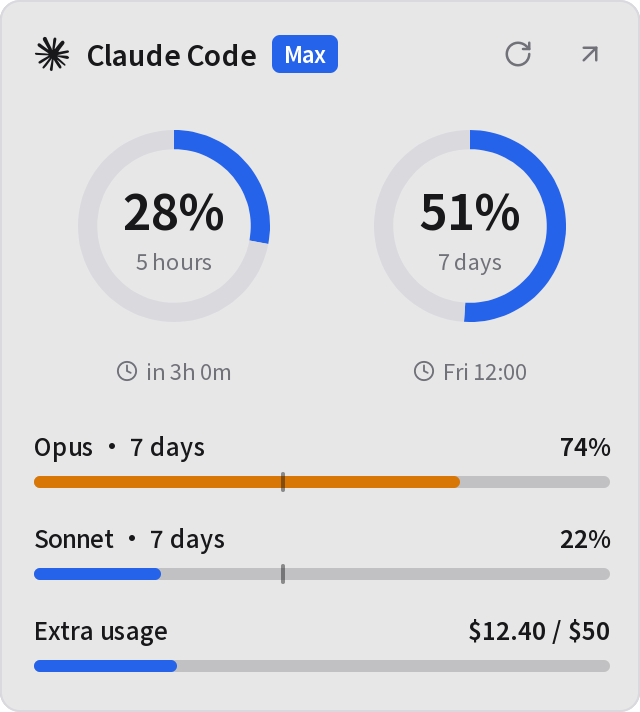
On macOS the value sits in the menu bar, beside the icon.
Your dashboard matters most. Just ask for it.
Connect once, then let Claude Code, Codex, or Cursor create, edit, validate, and configure dashboards, refresh data, and manage your installed dashboards.
You ask your agent for a GitHub repository dashboard. It validates the .bar file, installs the dashboard, sets the repository, and refreshes the data. The star count appears in the menu bar, and a click opens the full panel.
Try asking
Put my GitHub repository’s stars, forks, and latest release in the menu bar.
Install the Agent Skill
npx skills add https://metrix.barOn the Agent page, use Copy Prompt and send it to your agent to connect.
Read the Agent guideMore than numbers: what one .bar file can do
Scripts run in a sandboxed Worker with Web standards and desktop APIs. Each capability is opt-in and limited to what the file declares.
Network and realtime
Fetch, WebSocket, TCP, TLS, and UDP sockets, and DNS queries to the origins you declare.
Local storage
SQLite, IndexedDB, and a response cache that survive restarts and keep working offline.
Compute
WebAssembly, pinned ESM imports from a CDN, Intl, Temporal, and Web Crypto.
Hardware
CPU, memory, disk, network, batteries, peripheral battery levels, Bluetooth LE, and HID devices.
Media and alerts
Now-playing details and playback control, notifications, sound, and app badges.
Images
Barcodes, text and face recognition, HTML rendered to images, and panel screenshots. Some run on macOS only.
Accounts and files
OAuth sign-in in the browser, secrets in the system credential store, local files, and drag and drop.
Inbox
Receive email and webhooks in a Plus inbox, then read, act on, or delete each message.
Native interface
Charts, tables, editors, Canvas shaders, and motion, drawn as native UI rather than a web view.
An inbox for every dashboard
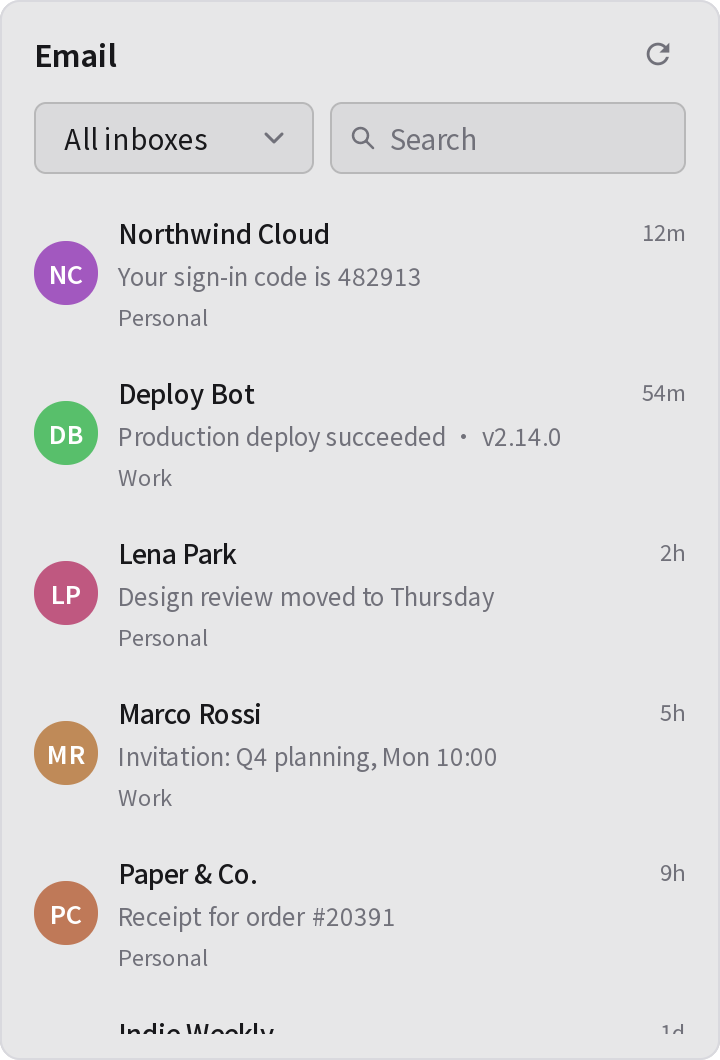
Each inbox gets its own email address and webhook URL. Dashboards bound to it read what arrives, act on it, and tell you.
Email address
Sign up or forward mail to an address like k7m2q9x4@agili-inbox.com.
Webhook URL
Point CI, payments, or any service at it. Secure deliveries with a URL secret, bearer token, header, or HMAC signature.
Dashboards that act
Email shows unread mail with one-click codes and links. Yours can turn deliveries into counts, charts, or alerts.
Alerts where you look
New mail can raise a notification or slide into the notch.
One file holds the whole dashboard
Your agent writes it, and you can read it. Each dashboard is a single .bar file you can edit, export, and share.
- Permissions
- Declares every origin it may reach. Requests anywhere else are refused.
- Inputs
- Become a native settings form. Secrets go to the system credential store.
- Script
- Fetches and renders in a sandboxed Worker with a resource budget.
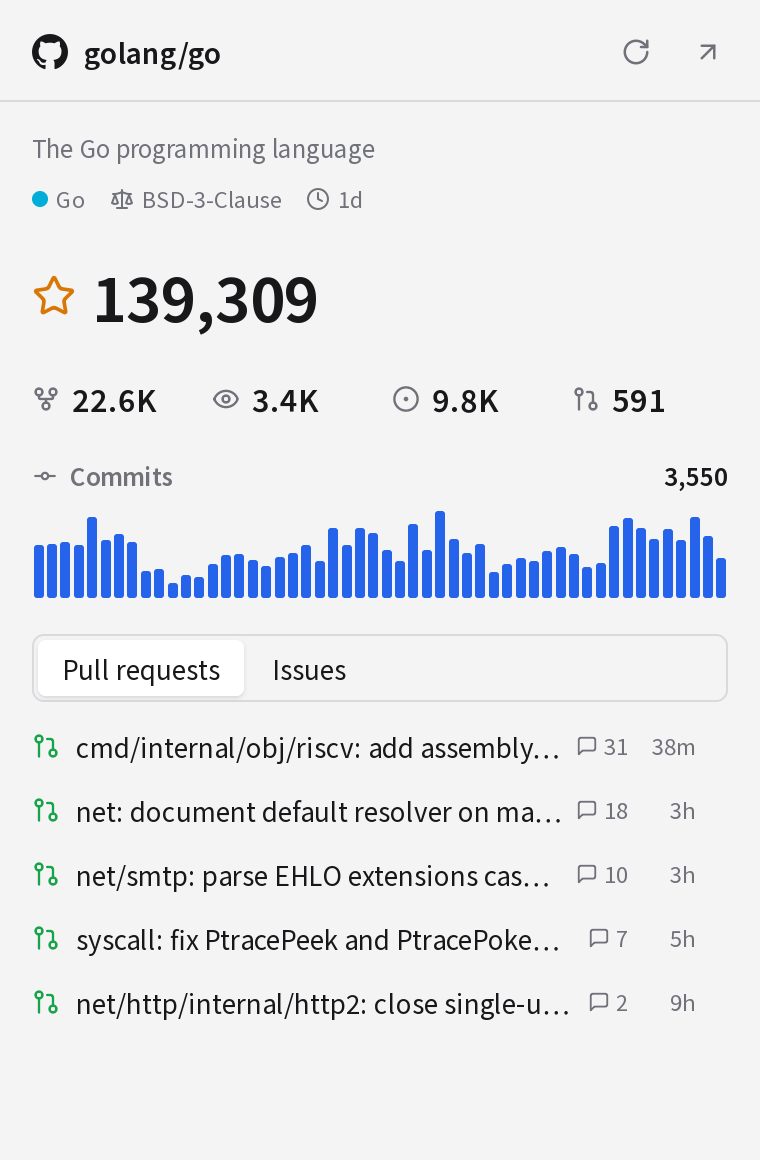
Official dashboards, ready to use
AI · Development · Music · Weather · Analytics
Built to live in your menu bar
Native on three platforms
Panels, windows, and system widgets are native UI, not a web view, on macOS, Windows, and Linux (Exp).
Local data, isolated credentials
Dashboard data and settings stay local; API keys live in the OS credential store.
A local API for your agent
Reachable from this machine only, behind a bearer token you can reset.
Free for up to three dashboards
Free
$0
No account needed.
- Up to 3 dashboards enabled at once, unlimited installed
- Menu bar, tray, and system widgets, and the panels and windows they open
- Local API and agent connection
Plus
- Quarterly
- US$4.99
- Annual
Original price US$14.99Limited timeUS$9.99- Lifetime
Original price US$29.99Limited timeUS$19.99
Quarterly and annual plans include a 7-day free trial and renew automatically until canceled. Lifetime is a one-time payment with no trial or renewal.
- Unlimited enabled dashboards
- Screen sidebars and global shortcuts
- The notch on macOS and Windows
- Standalone dashboard apps
- Inbox for email and webhooks
- Up to 3 activated devices
Build the menu bar app only you need
Start with official dashboards. Ask your agent for the rest.