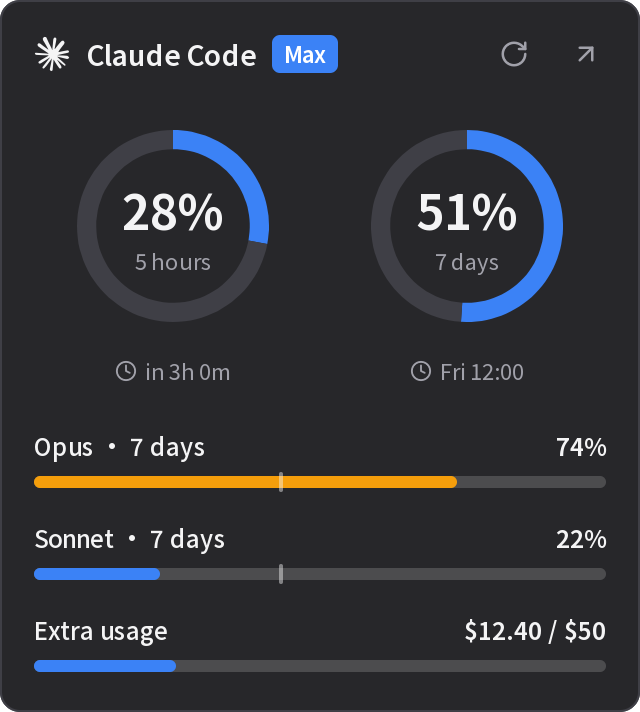
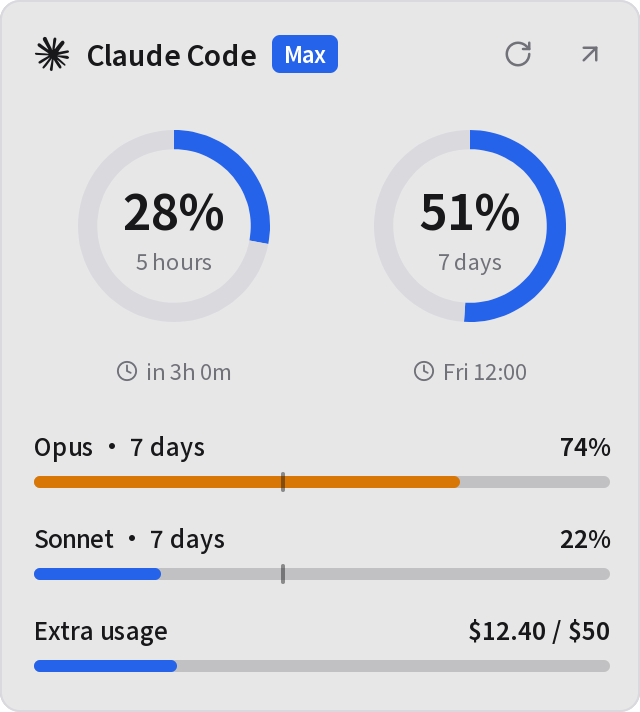
One number, three ways in
Glance at the menu bar, move to the edge of the screen, or press a key from any app. Each dashboard picks its own ways in, and how its panel opens.
On macOS the value sits in the menu bar, beside the icon.
Say what you want to watch. It lands in your menu bar.
Connect once, then let Claude Code, Codex, or Cursor create, edit, validate, and configure dashboards, refresh data, and manage your installed dashboards.
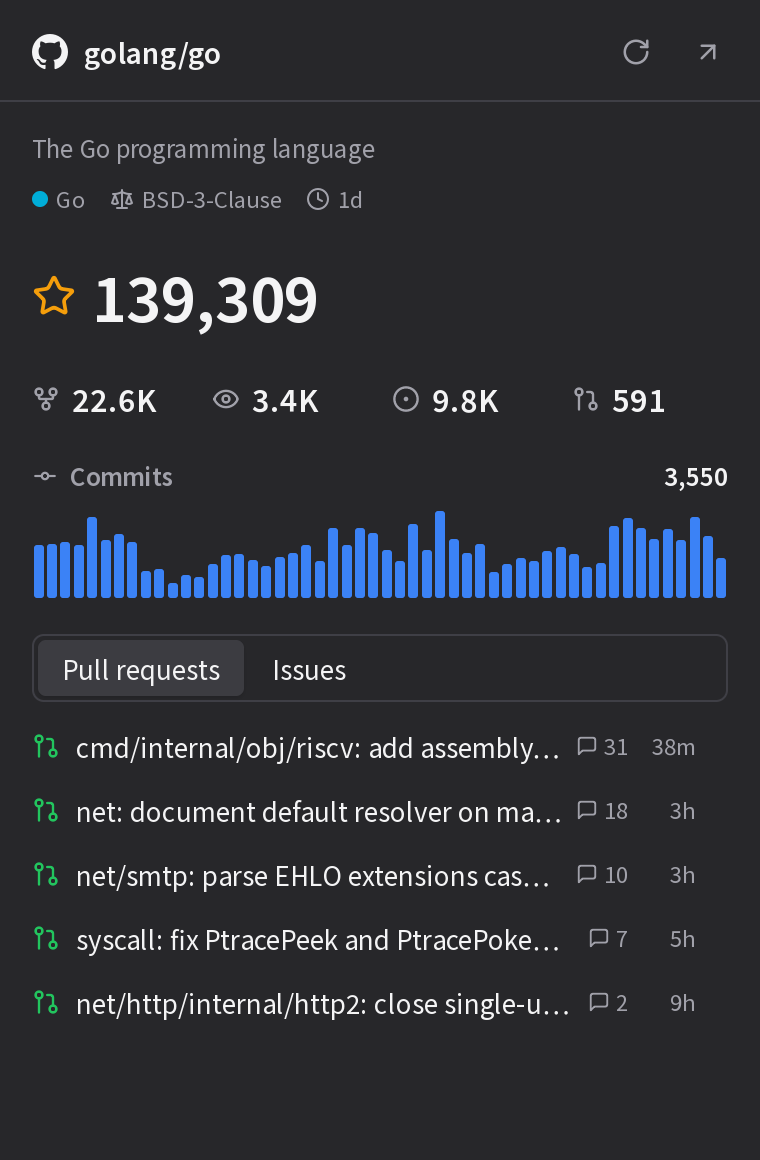
You ask your agent for a GitHub repository dashboard. It validates the .bar file, installs the dashboard, sets the repository, and refreshes the data. The star count appears in the menu bar, and a click opens the full panel.
Try asking
Put my GitHub repository’s stars, forks, and latest release in the menu bar.
Install the Agent Skill
npx skills add https://metrix.barOn the Agent page, use Copy Prompt and send it to your agent to connect.
Read the Agent guideOne file holds the whole dashboard
Your agent writes it, and you can read it. Each dashboard is a single .bar file you can edit, export, and share.
- Permissions
- Declares every origin it may reach. Requests anywhere else are refused.
- Inputs
- Become a native settings form. Secrets go to the system credential store.
- Script
- Fetches and renders in a sandboxed Worker with a resource budget.
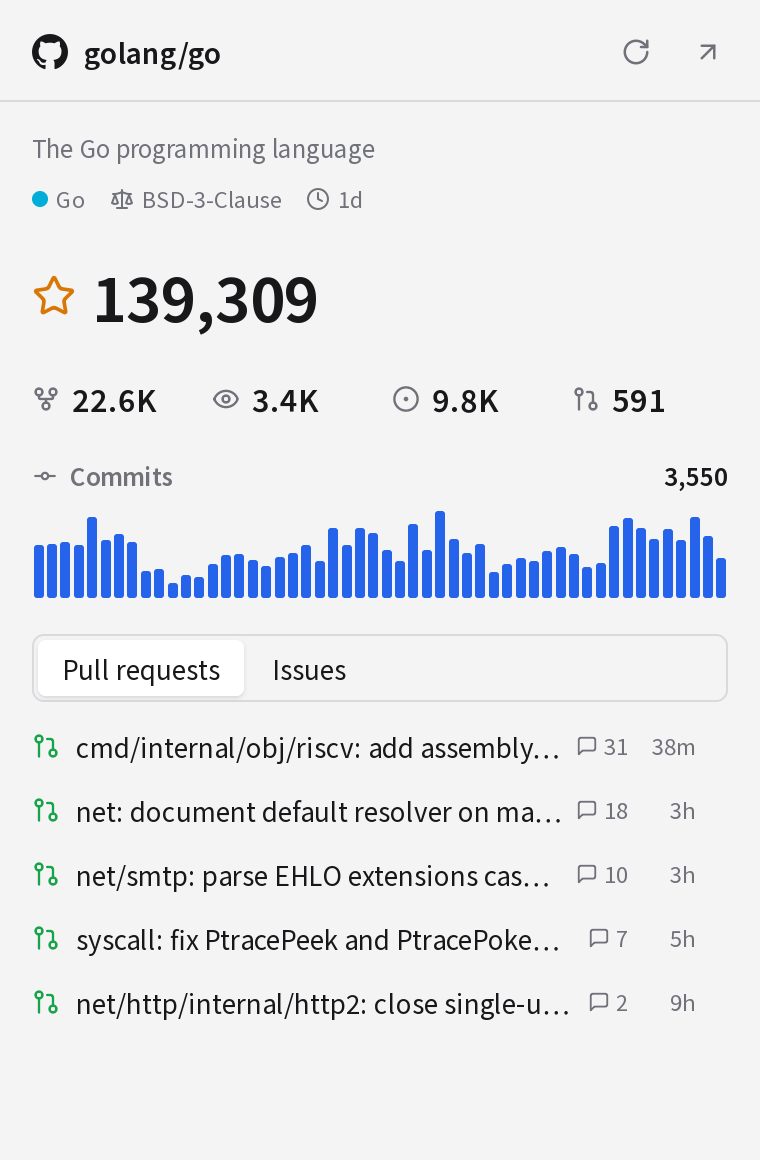
Official dashboards
AI · Development · Weather · Analytics
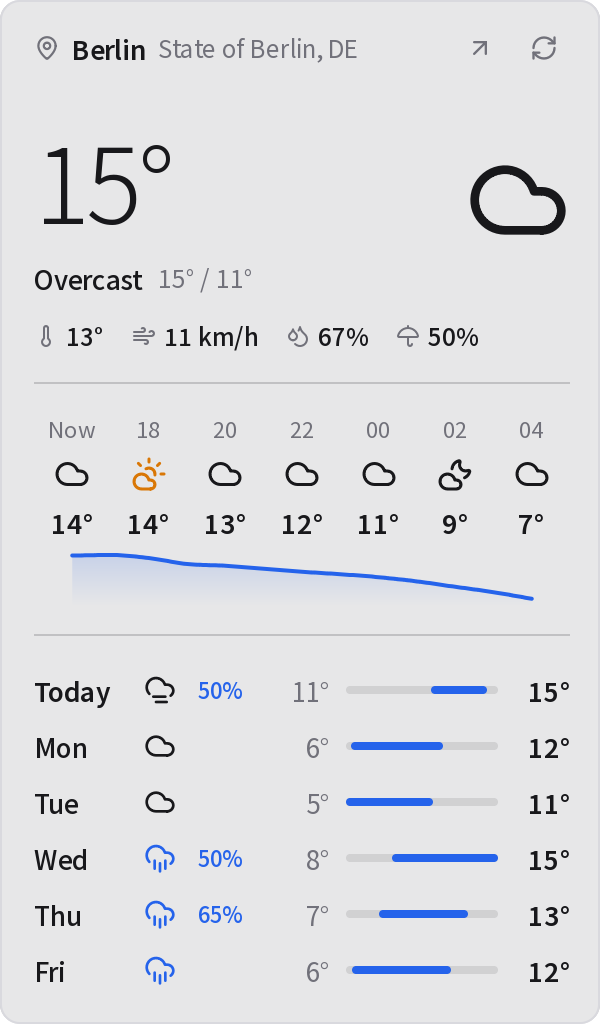
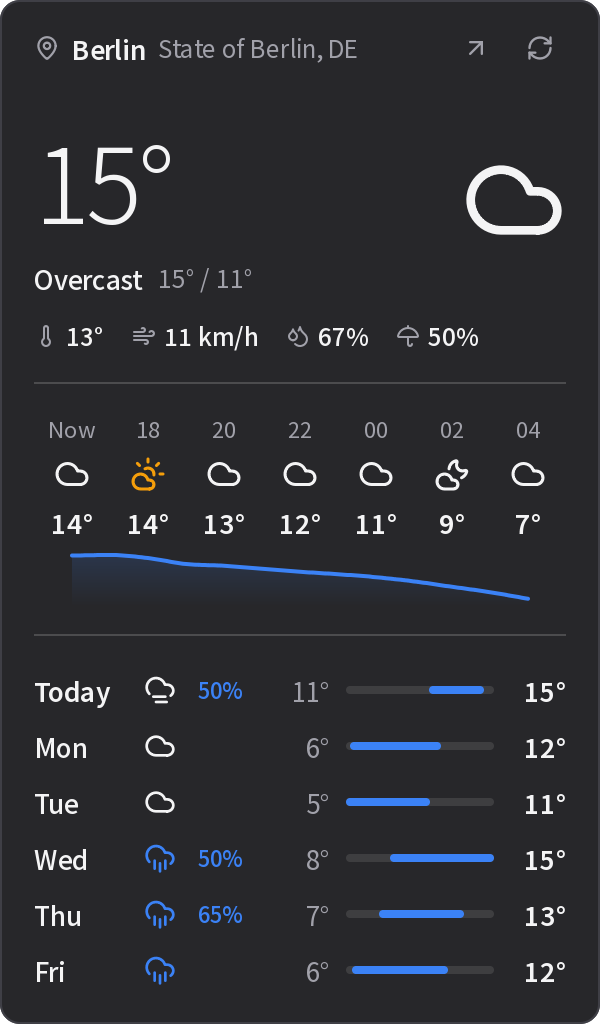
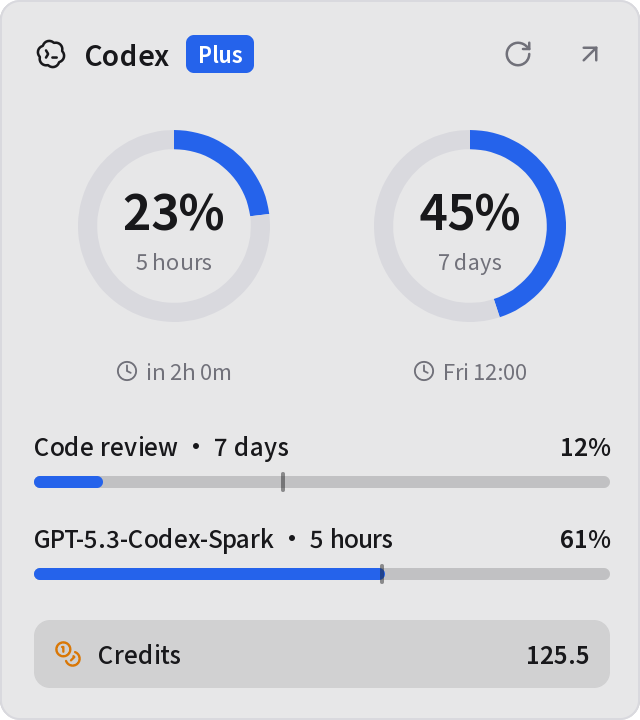
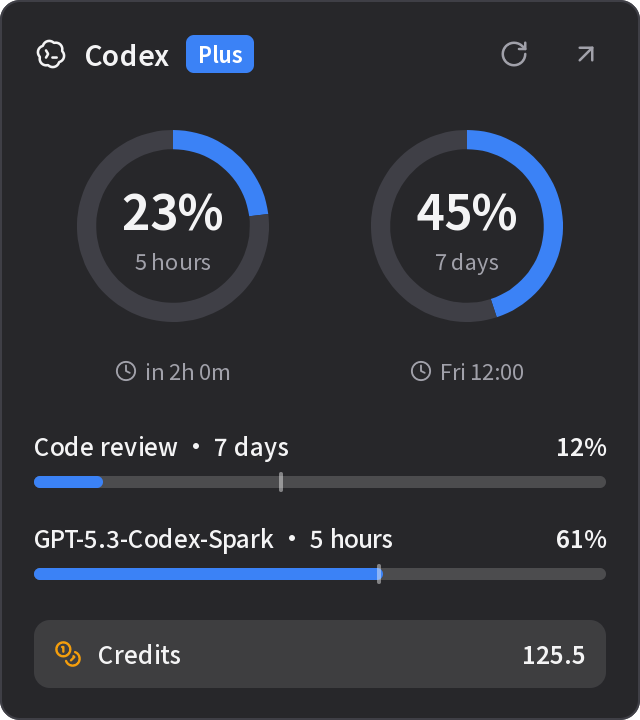
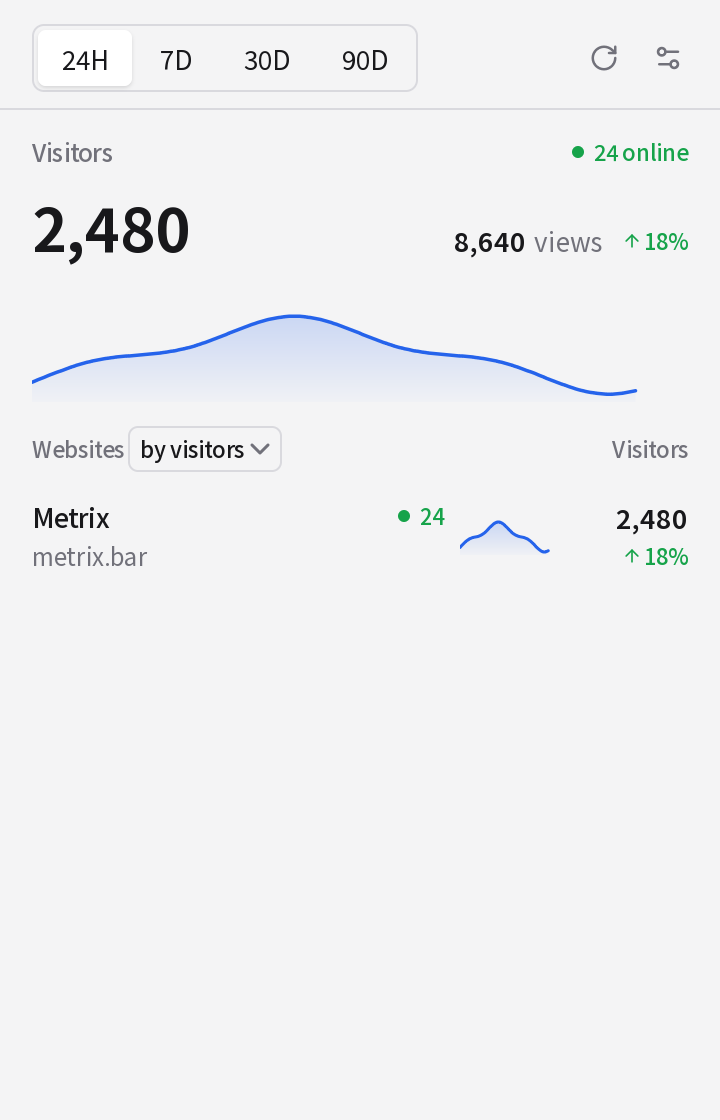
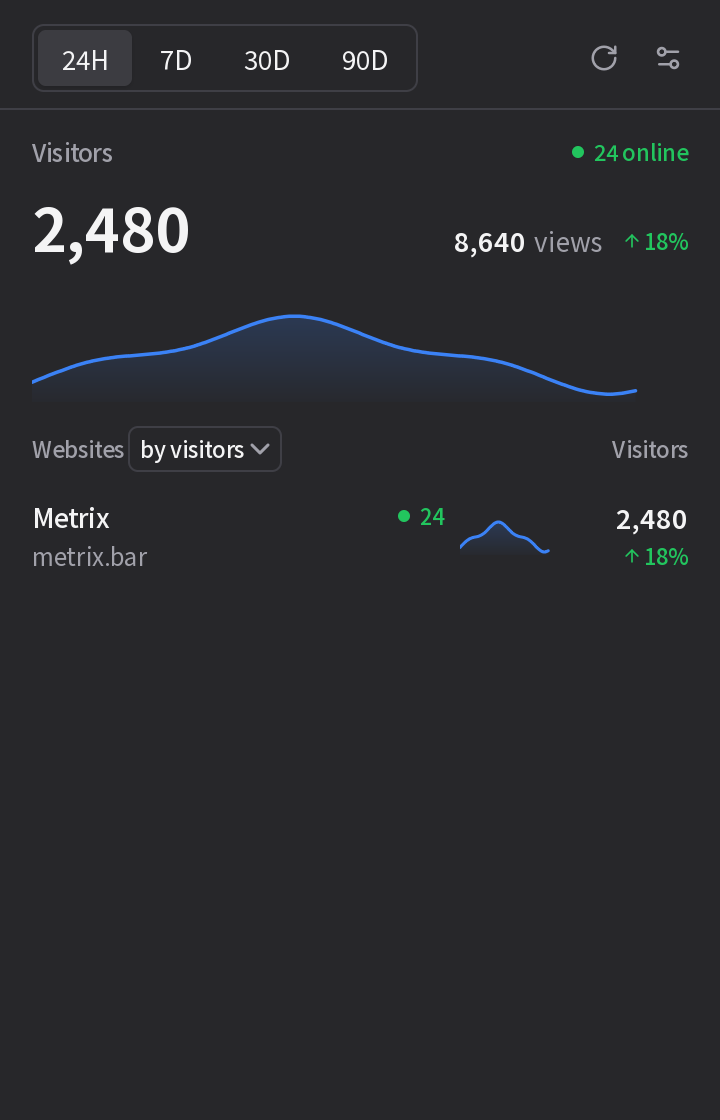
Built to live in your menu bar
Native on three platforms
Panels and windows are native UI, not a web view, on macOS, Windows, and Linux (Exp).
Local data, isolated credentials
Dashboard data and settings stay local; API keys live in the OS credential store.
Permissions you can read
A .bar file lists the origins it may reach. Requests anywhere else are refused.
A local API for your agent
Reachable from this machine only, behind a bearer token you can reset.
Free for up to three dashboards
Metrix.Bar is free for up to 3 dashboards at once. Plus is US$4.99 per month with a 7-day free trial.
Free
$0
No account needed.
- Up to 3 dashboards enabled at once, unlimited installed
- Menu bar and tray panels, and the windows they open
- Local API and agent connection
Plus
US$4.99per month
7-day free trial, then billed monthly. Renews automatically until canceled.
- Unlimited enabled dashboards
- Screen sidebars
- Global shortcuts
- Up to 3 activated devices
Put your first number in the menu bar
Connect once. Ask for the metrics you need.
- 1
Install and launch the app
Choose the build for your system, then launch it.
- 2
Install the Skill
Add the Agent Skill to your coding assistant.
- 3
Connect your agent
On the Agent page, use Copy Prompt and send it to your agent.
- 4
Ask for your metrics
Describe what matters and let your agent create and refine your dashboard.